Sales Analytics
Track your revenue, sales trends, and bundle performance.
The Sales analytics tab on your Creator Dashboard shows you how your content is performing — total sales, revenue trends over time, and a per-bundle breakdown. Everything updates automatically as purchases come in.
At-a-glance stats
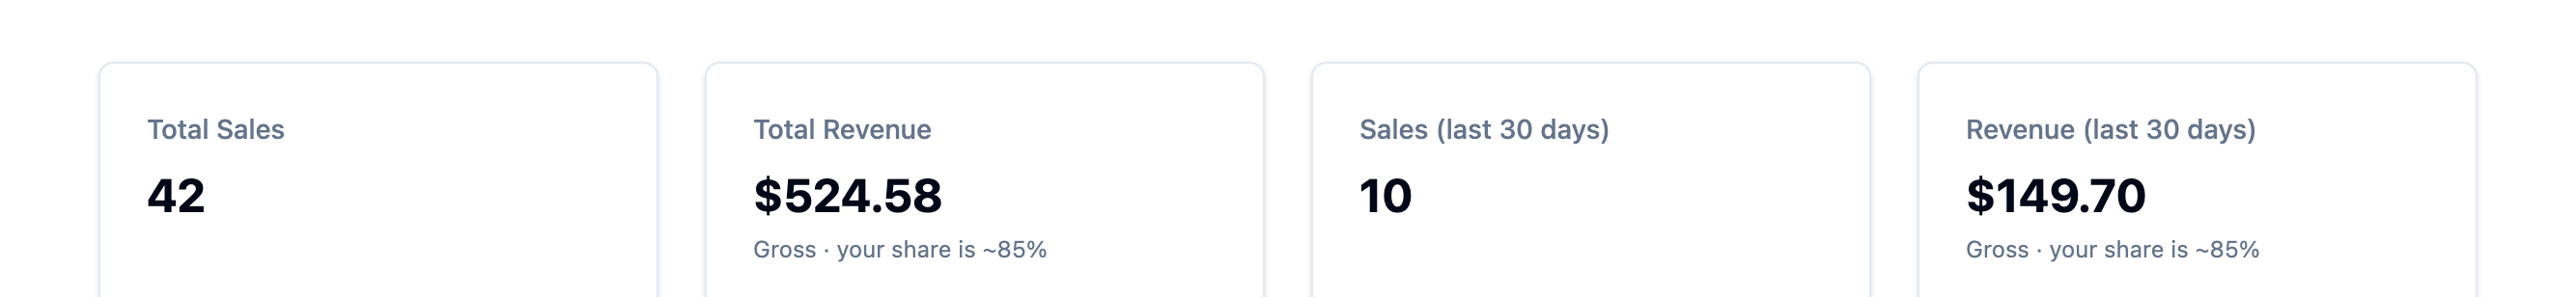
Four cards across the top give you the headline numbers:
Total Sales — the total number of bundle purchases across all your podcasts, all time.
Total Revenue — the gross amount collected from those sales (the full price your listeners paid). Beneath this you'll see "Gross · your share is ~85%", a reminder that after Stripe's card processing fees and Pony Up's 15% platform fee, you keep over 80% of each sale. For exact figures on a specific price point, see the Pricing & Fees guide.
Sales (last 30 days) — bundle purchases in the rolling 30-day window. This is your best quick-check number for whether sales momentum is building or slowing.
Revenue (last 30 days) — gross revenue for the same 30-day window, again with the over 80% share note.
Earnings over time
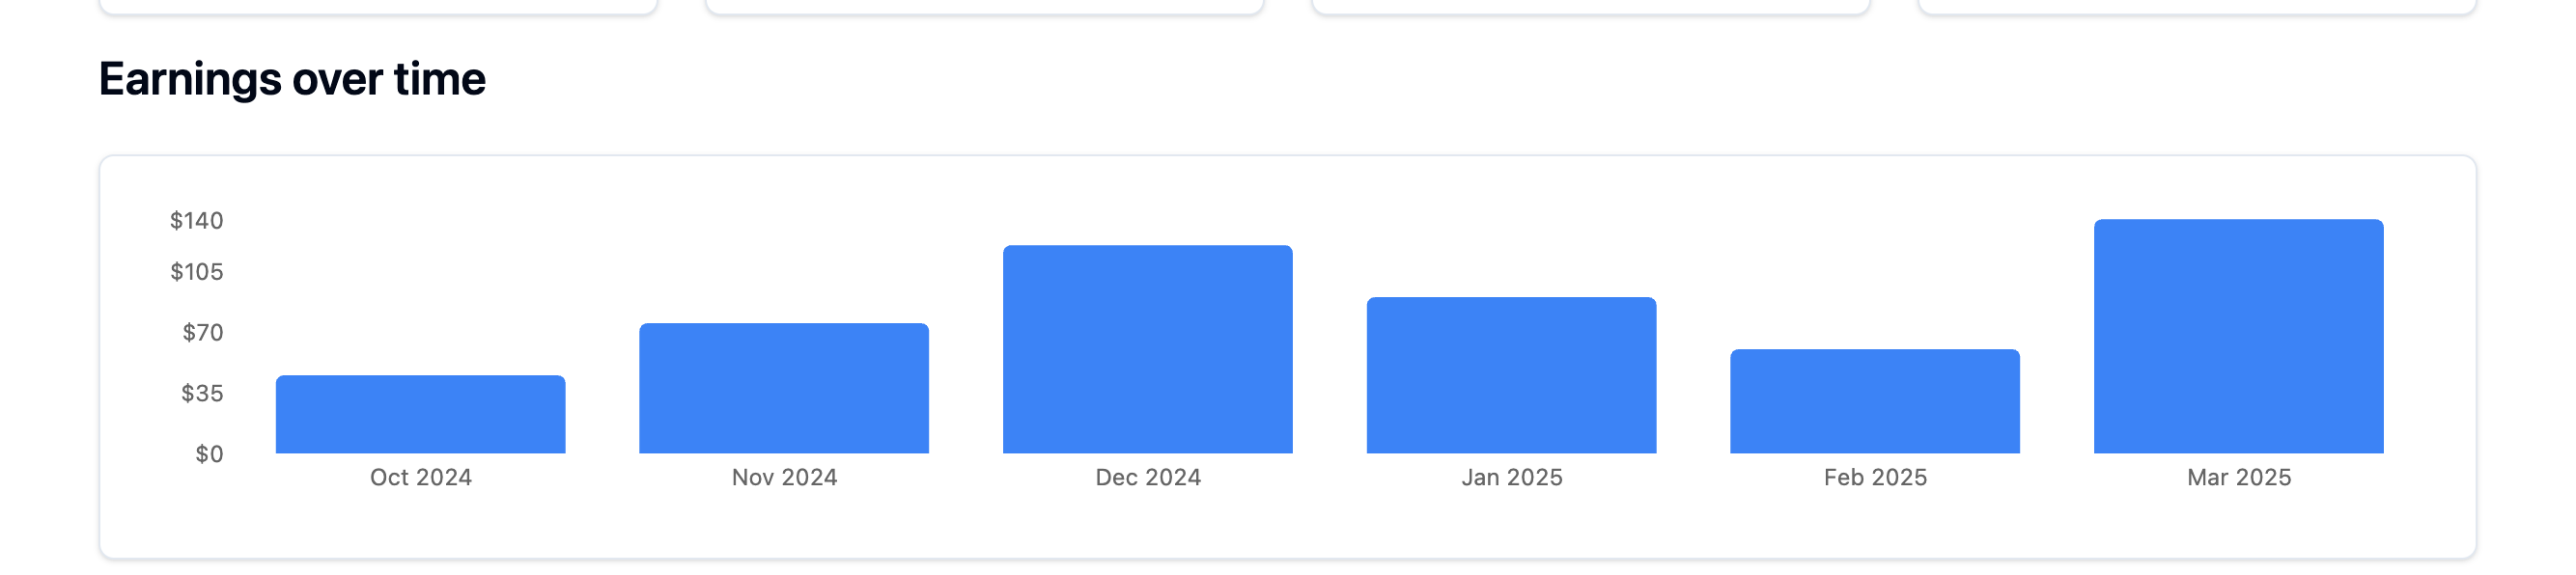
A bar chart plots your gross monthly revenue for the last six months. Each bar represents one calendar month.
Things to look for:
Growth trend — are the bars getting taller month over month? If so, your promotion strategy is working and new listeners are finding your storefront.
Seasonal patterns — sales commonly dip around holidays or over summer. If you spot a recurring pattern, plan your bundle releases and promotion pushes around it.
Launch spikes — you'll often see a jump in the month you release a new bundle, followed by a settle. That's healthy. The question is whether the baseline after the spike is higher than before — if it is, each release is bringing in new listeners who stick around to buy more.
Bundle performance
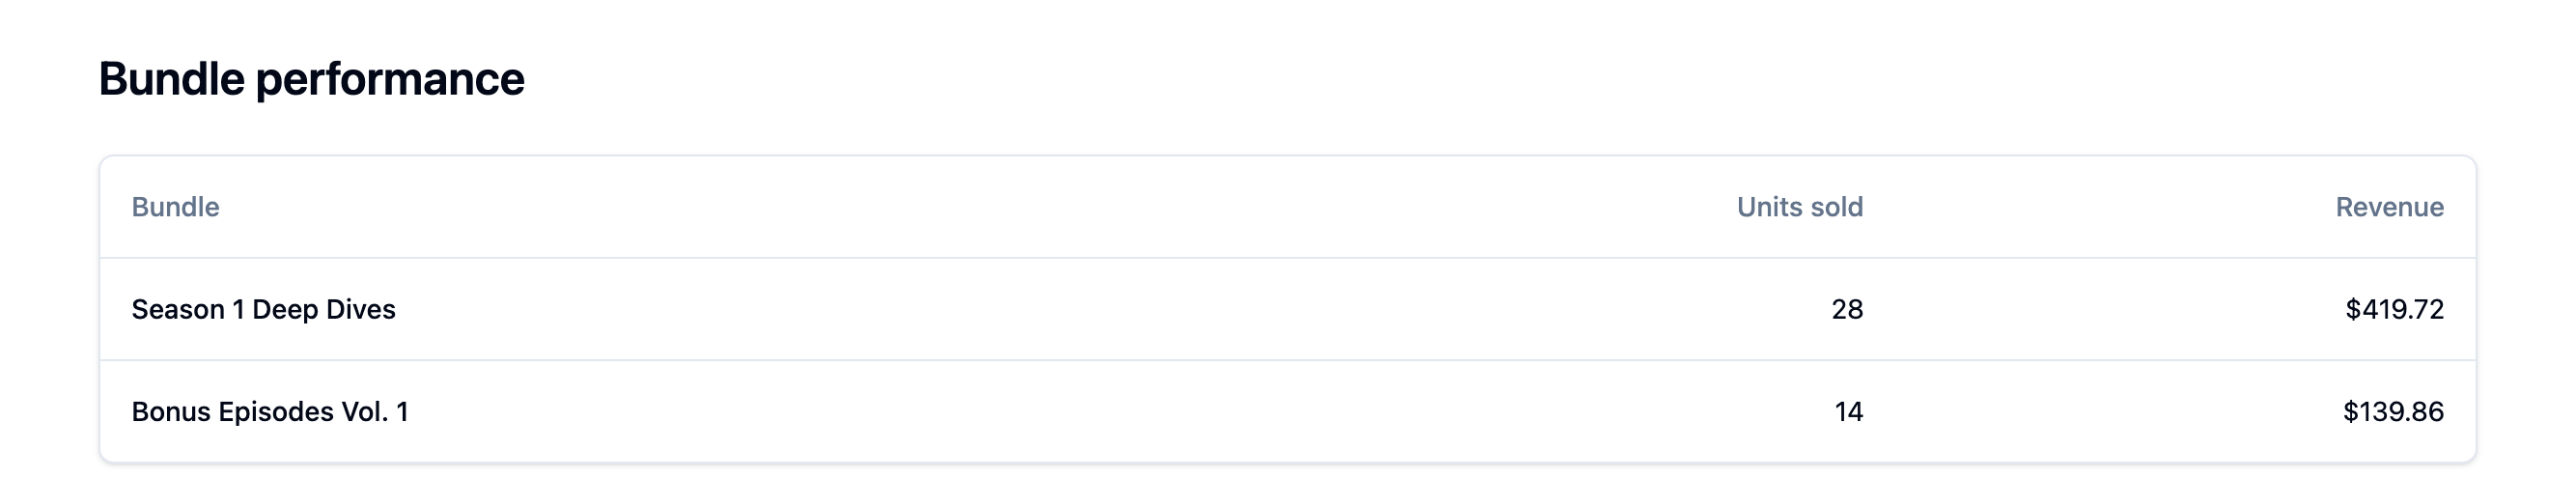
A table ranks your bundles by revenue. For each bundle you can see:
- Bundle — the title you gave it
- Units sold — the number of completed purchases
- Revenue — the gross amount collected
This is the fastest way to spot what's resonating. If one bundle significantly outsells the others at a similar price, dig into what's different — the topic, the title, the description, or when and how you promoted it.
If a bundle has very few sales, it might need more visibility (mention it in a recent episode, share the direct link on social media) or a pricing adjustment.
Recent transactions
Below the performance table, a chronological list shows your most recent individual sales — the bundle title, the date of purchase, and the amount paid.
This feed is mostly useful as real-time confirmation that sales are flowing, especially right after you've promoted a link or released something new. If you've just mentioned your Pony Up storefront in an episode, check back here in the next day or two to see if it's converting.
What's shown and what isn't
All figures on this tab are gross — the full price the listener paid. The amount that reaches your bank will be lower after fees. See Pricing & Fees for the exact breakdown.
Free bundles (priced at £0) don't go through Stripe checkout, so they won't appear in sales analytics.
Listener location data and buyer behaviour (countries, unique buyers, repeat purchases) live on the separate Listener demographics tab.