Listener Demographics
See where your buyers are, which bundles they're choosing, and how often they come back.
The Listener demographics tab on your Creator Dashboard helps you understand who your buyers are — where they're located, how many you've reached, and whether they're coming back for more.
At-a-glance stats
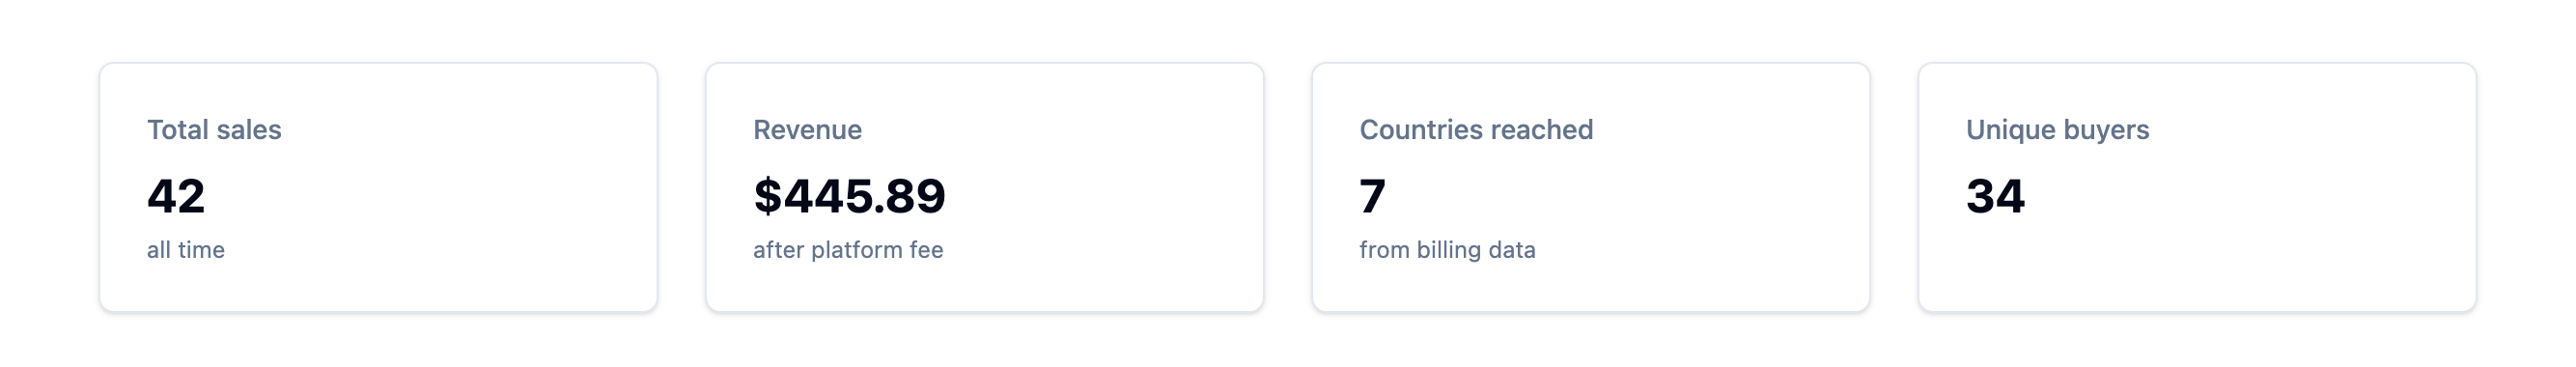
Four cards across the top summarise your audience:
- Total sales — the all-time number of bundles sold, labelled "all time" to distinguish it from rolling windows.
- Revenue — your revenue after the platform fee has been deducted. Unlike the Sales analytics tab which shows gross figures, this number reflects what actually flows towards you. The label "after platform fee" makes this explicit.
- Countries reached — the number of different countries your buyers are in. The label "from billing data" clarifies that this comes from the billing country Stripe collects at checkout.
- Unique buyers — the count of distinct listeners who have purchased at least one of your bundles. This helps you understand whether your sales are coming from a large audience or a smaller group of repeat buyers.
Where your listeners are
A horizontal bar chart ranks the countries your buyers are located in, from most purchases to fewest. Each row shows:
- A country flag
- The country name
- A proportional bar showing relative volume
- The number of sales from that country
The top five countries are shown individually. Remaining countries are collapsed into a "+ X others" row with their combined count.
Below the chart, a note reads: "Based on billing country collected by Stripe at checkout. Does not include £0 purchases." This means:
- The country data comes from whatever billing address the listener provided to Stripe — it's not IP-based geolocation, so it's a reasonably reliable indicator of where your buyers actually are.
- Free bundles don't go through Stripe, so they have no billing data and won't appear in the geographic breakdown.
This data is especially useful for shaping your promotion strategy. If you're a UK-based podcaster and you see meaningful traction in the US or Australia, that's a signal to consider time zones when you promote your storefront on social media, or to mention your Pony Up link in episodes that skew towards those audiences.
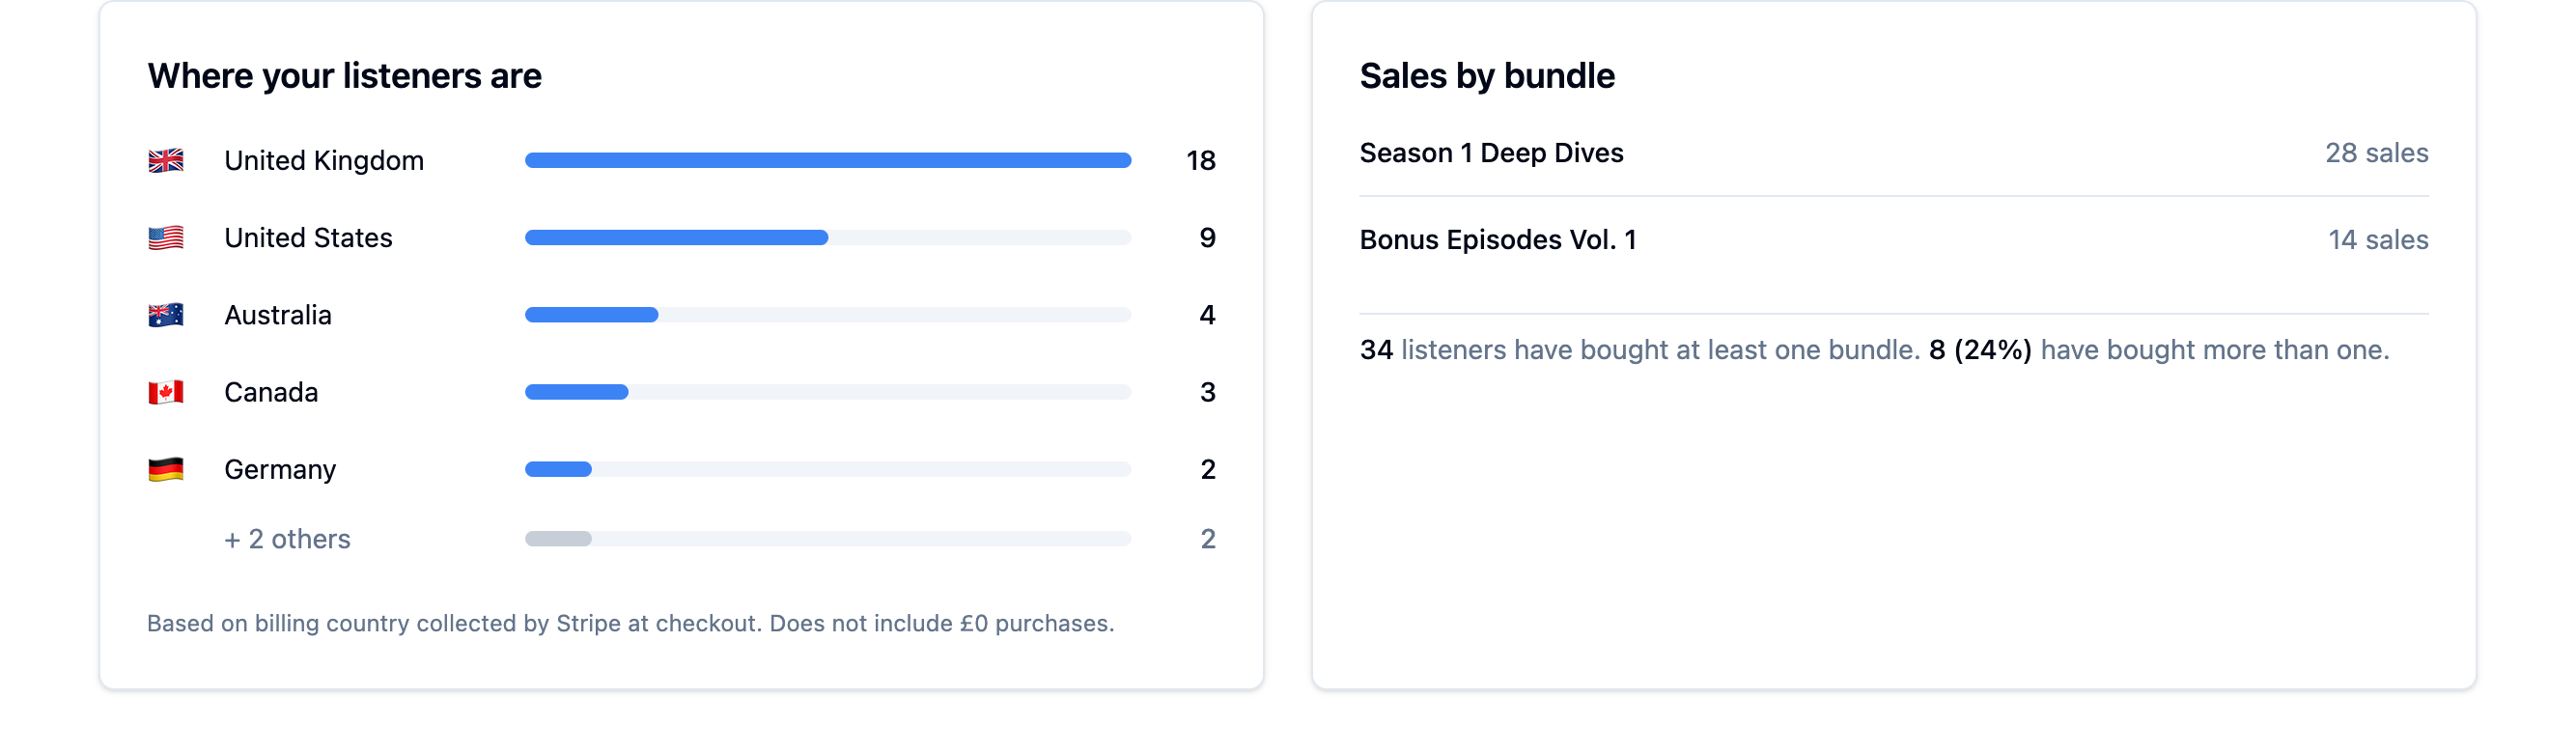
Sales by bundle
A companion list on the right-hand side shows each of your bundles ranked by units sold. This gives you a different lens on the same audience — useful for spotting which bundles have broad geographic appeal versus a concentrated local following.
If your country chart shows strong UK sales but your most popular bundle is something with universal appeal (like a masterclass or a themed collection), that suggests there's untapped potential in other markets where you haven't promoted as heavily yet.
Repeat purchase rate
At the bottom of the Sales by bundle section, a summary line tells you:
- How many of your unique buyers have purchased at least one bundle
- How many (and what percentage) have purchased more than one
This repeat-purchase rate is one of the most important signals on your entire dashboard. A high repeat rate means your content is landing well and listeners trust that your bundles are worth paying for. A low rate with strong first-purchase numbers might mean your storefront is doing its job attracting new buyers, but the follow-up content isn't compelling enough to bring them back — or they simply haven't discovered your other bundles yet.
Tips
Don't ignore small country numbers. Even a handful of sales from a new country is a signal. Those early buyers are likely your most engaged international listeners — they went out of their way to find and pay for your content. A mention in an episode or a social post targeted at that audience can turn a trickle into a stream.
Compare unique buyers to total sales. If you have 50 unique buyers and 200 total sales, your average buyer has purchased 4 bundles — that's a very strong signal. If you have 150 unique buyers and 200 sales, most people are buying just once. Both are fine at different stages, but they call for different strategies: the first means you should focus on reaching new listeners; the second means you should focus on giving existing buyers a reason to come back.
Use demographics alongside Sales analytics. The two tabs complement each other. Sales analytics tells you what is selling and how much. Demographics tells you who is buying and where. Together they answer the question: "What should I create or promote next?"